Trusted by Leading Brands













Built for
Multi-Carrier Operations
Domestic & international shipping
Mid-Market & Enterprise
Shopify Plus, SFCC, BigCommerce
Global Fulfillment Networks
Multiple warehouses & carriers
You Can't Optimize What You Can't Measure.
Most brands rely on carrier dashboards that only show part of the picture. Without unified analytics across your entire shipping operation, you're making decisions in the dark — and paying for it.
5–15%
Typical shipping cost savings when brands gain full visibility into carrier performance*
3–5
Average number of carrier dashboards brands juggle — none of which talk to each other
0%
Visibility most brands have into how promised vs. actual delivery dates compare
Brands that unify their shipping analytics see measurable improvements in on-time delivery and significant reductions in shipping costs — because they can finally see the full picture.
— Based on FenixCommerce customer data and industry benchmarks
Stop Guessing. Start Knowing.
FenixCommerce replaces fragmented carrier dashboards with a single, unified intelligence platform.
Fragmented Carrier Dashboards
- 5+ separate dashboards that don't share data
- No way to compare carrier performance side-by-side
- Manual Excel exports to build basic reports
- Zero visibility into promised vs. actual delivery accuracy
- Carrier rate negotiations based on gut feeling, not data
FenixCommerce Shipping Intelligence
- One unified dashboard across all carriers and fulfillment centers
- Side-by-side carrier performance benchmarking
- 40+ pre-built KPI reports — no setup required
- Delivery accuracy tracking with promised vs. actual comparison
- Data-driven carrier negotiations with concrete performance data
Brands Using Shipping Intelligence
Results from brands using FenixCommerce's unified shipping analytics platform.

Dermalogica: Unified Shipping Visibility
Dermalogica, a Unilever prestige skincare brand, deployed the full FenixCommerce platform including shipping analytics. With unified visibility across carriers and fulfillment centers, they achieved significant operational improvements.
95%
Split-Shipment Reduction*
100+
Countries Served
"The real star so far is Fenix Order Routing by significantly reducing our split shipments, directly impacting our bottom line."
— Sandy Johnson, Director of eCommerce, Dermalogica
Source: fenixcommerce.com/clients/dermalogica-case-study
*Result achieved using the full FenixCommerce platform (EDD + Order Routing + Analytics). Individual results vary.
Bombas: Data-Driven Shipping Optimization
Bombas used FenixCommerce's shipping intelligence and carrier optimization to achieve significant shipping cost savings while maintaining delivery performance.
Source: fenixcommerce.com/clients
*Results from the full FenixCommerce platform. Individual results vary.
6x
Return on Investment*
$1.5M
Annual Shipping Savings*
45+ Pre-Built KPI Reports
Instant visibility into every dimension of your shipping operations — no setup required.
Total Count
Aggregate count of all orders and shipments across your network, providing a real-time pulse on overall shipping volume.
Top N Shipping Source
Identifies the highest-volume origination points in your fulfillment network, helping you allocate resources and optimize warehouse utilization.
Top N Shipping Option
Ranks the most frequently selected shipping methods by customers, revealing demand patterns for express, standard, and economy services.
Top N Buyer State
Highlights the geographic regions generating the most orders, enabling targeted fulfillment strategy and regional carrier negotiations.
Filtered Count
Dynamic count of orders matching custom filter criteria — date range, carrier, status, or region — for granular operational analysis.
Order Count by Order Date
Daily, weekly, or monthly order volume trends to identify seasonality, demand spikes, and forecast future shipping capacity needs.
Order Count by Buyer State
Geographic distribution of orders across states, powering decisions on fulfillment center placement and zone-based carrier strategies.
Shipment Count by Fulfillment Location
Volume breakdown per warehouse or fulfillment center, ensuring balanced workload distribution and identifying capacity constraints.
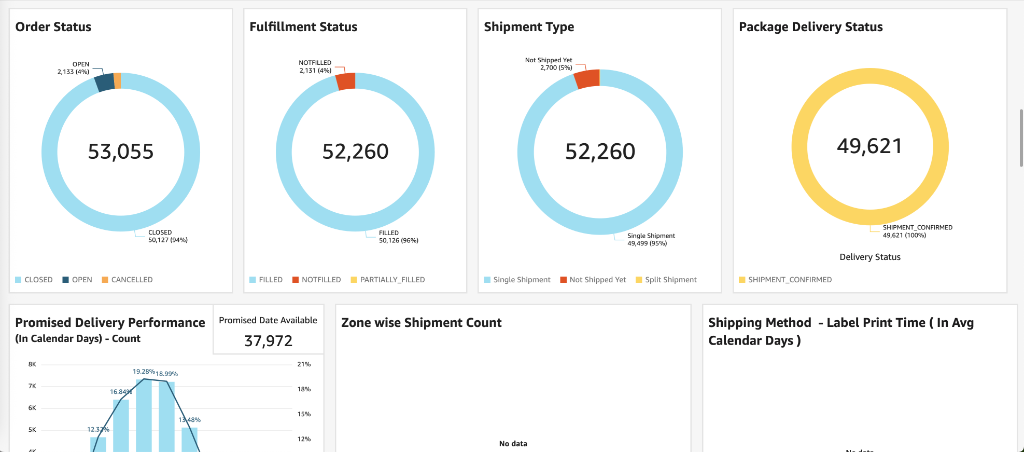
Order Status
Real-time breakdown of orders by lifecycle stage — pending, processing, shipped, delivered, and exceptions — for complete pipeline visibility.
Fulfillment Status
Tracks fulfillment progress from pick-pack to dispatch, identifying bottlenecks that delay shipment and impact delivery promises.
Shipment Type
Distribution of shipment types — single-package, multi-package, freight, and parcel — to optimize packaging and carrier selection strategies.
Package Delivery Status
Current delivery status of all packages — in transit, out for delivery, delivered, attempted, returned — with exception flagging.
Promised Delivery Performance (Calendar Days)
Measures how actual delivery dates compare to promised dates in calendar days, quantifying on-time delivery reliability.
Zone-wise Shipment Count
Shipment volume segmented by shipping zones, revealing cost and transit-time patterns to optimize zone-skip and regional routing strategies.
Shipping Method - Label Print Time (Avg Calendar Days)
Average time from order placement to label generation per shipping method, identifying processing speed differences across service levels.
Shipment Method - Carrier Service
Maps shipping methods to actual carrier services used, ensuring alignment between customer-selected options and carrier execution.
Label Print Count - Day of the Week
Label generation volume by weekday, revealing operational throughput patterns and helping optimize staffing schedules.
Package Delivery Performance (Calendar Days)
End-to-end delivery time from order placement to doorstep in calendar days, benchmarked across carriers and shipping methods.
Package Processing Performance (Order to First Scan)
Measures the time gap between order placement and the first carrier origin scan, isolating warehouse processing efficiency.
Carrier Transit Time (First Scan to Delivered)
Pure carrier transit time from first origin scan to delivery, isolating carrier performance from warehouse processing delays.
Order Placed Day → Label Print Day
Time delta between order placement and label creation, segmented by day, to identify processing lags and SLA compliance.
Label Print Day → Pickup Day
Measures the handoff gap between label printing and carrier pickup, highlighting scheduling and manifest cut-off optimization opportunities.
Pickup Day → Delivered Day
Carrier in-transit duration from pickup to final delivery, enabling carrier-by-carrier transit time benchmarking.
Pickup → Delivered (Calendar Days)
Calendar-day measurement of carrier transit performance, accounting for weekends and holidays for realistic delivery expectations.
Carrier Services - Self Delivery Accuracy
Compares each carrier's actual delivery performance against their own committed service levels and transit time promises.
Shipping Options - Delivered (Calendar Days)
Actual delivery time per customer-facing shipping option, ensuring your displayed delivery promises match real-world performance.
Carrier Service - Delivered (Calendar Days)
Granular delivery time analysis per carrier service level, powering data-driven carrier selection and rate negotiations.
Order → Label Performance (Calendar Days)
Tracks the internal processing speed from order receipt to label generation, a critical metric for same-day and next-day fulfillment.
Label → Pickup Performance (Calendar Days)
Monitors the efficiency of your carrier pickup process, identifying delays between label creation and actual carrier collection.
Service Name - Package Weight Analysis
Correlates package weight with carrier service selection, identifying opportunities for dimensional weight optimization and cost savings.
Delivery Accuracy
Percentage of shipments delivered on or before the promised date, the gold-standard KPI for post-purchase customer experience.
Delivery Accuracy Trend
Longitudinal trend of delivery accuracy over time, revealing improvement trajectories and the impact of operational changes.
Shipping Accuracy
Measures how accurately orders are shipped with the correct carrier, service, and method versus what was originally planned or recommended.
Shipping Accuracy Trend
Tracks shipping accuracy improvements or regressions over time, correlating with process changes and carrier performance shifts.
Shipped Carrier Service (Recommended vs Different)
Compares the AI-recommended carrier service against the actually shipped service, quantifying adherence to optimization recommendations.
Shipped Service → Recommended Service
Maps the relationship between shipped and recommended services, identifying patterns where overrides improve or degrade performance.
Delivery Accuracy by Fulfillment ID
Delivery accuracy segmented by fulfillment center, identifying which locations consistently meet or miss delivery promises.
Shipping Accuracy by Fulfillment ID
Shipping accuracy per fulfillment center, revealing operational consistency differences across your warehouse network.
Shipped Option - Transit Time (Promised Delivery Spread)
Distribution of actual transit times against promised delivery windows per shipping option, visualizing delivery reliability variance.
Shipped Option - Transit Time (Expected Shipping Spread)
Expected shipping time distribution per option, helping set accurate customer expectations and identify service-level mismatches.
Order Count: Order Day → Label Print Day
Volume analysis of the order-to-label time gap, identifying processing backlogs and peak-hour bottleneck patterns.
Order Count: Label Print Day → Pickup Day
Volume breakdown of label-to-pickup intervals, optimizing carrier pickup schedules and manifest cut-off times.
Order Count: Order Day → Pickup Day
End-to-end pre-transit volume analysis from order placement to carrier handoff, the key metric for fulfillment speed optimization.
Fulfillment Location → Recommended Location
Compares actual fulfillment locations used against AI-recommended optimal locations, quantifying routing optimization potential.
Shipped Carrier Service (Recommended vs Actual)
Full comparison matrix of recommended versus actual carrier services, with cost and transit-time impact analysis for every deviation.
All reports are fully customizable with filters, date ranges, and export options.
Full Visibility in Minutes — Not Months
Three simple steps to unified shipping intelligence across your entire operation.
Connect Your Carriers & Platforms
Pre-built integrations with 100+ carriers and all major e-commerce platforms. Connect once and get unified data flowing in minutes.
Explore 40+ Pre-Built Reports
Instantly access KPI reports across delivery performance, carrier analysis, fulfillment efficiency, accuracy trends, and optimization opportunities.
Optimize & Save
Use data-driven insights to negotiate better carrier rates, optimize fulfillment routing, and improve on-time delivery across your network.
"But We Already Have Shipping Reports..."
Here's why leading brands chose unified intelligence.
🤔"We already use carrier dashboards for reporting."
Carrier dashboards show you their data — not your data. They can't compare performance across carriers, correlate with fulfillment operations, or measure promised vs. actual delivery accuracy. FenixCommerce unifies everything in one place.
🤔"We export data to Excel and build our own reports."
That works until it doesn't. Manual exports are time-consuming, error-prone, and always out of date. FenixCommerce gives you 40+ live, pre-built reports that update in real-time — no spreadsheets required.
🤔"How is this different from our OMS analytics?"
Your OMS tracks order lifecycle. FenixCommerce tracks shipping performance — carrier transit times, delivery accuracy, zone analysis, and cost optimization. They're complementary: one manages orders, the other optimizes delivery.
🤔"We don't have the bandwidth to set up another analytics tool."
FenixCommerce connects to your existing carriers and platforms in minutes. All 40+ reports are pre-built and ready to use — no configuration, no custom dashboards, no BI team required.
Shipping Intelligence
40+ Pre-Built KPI Reports
Instant access to reports across delivery performance, carrier analysis, fulfillment efficiency, and optimization — no setup required.
Carrier Performance Benchmarking
Side-by-side comparison of carrier transit times, delivery accuracy, and cost efficiency across your entire network.
Delivery Accuracy Tracking
Compare promised vs. actual delivery dates across every carrier, service level, and fulfillment center.
E-commerce Integrations
Pre-integrated with the platforms you already use — launch in days, not months.
 Shopify
 BigCommerce
 Salesforce
 Adobe
AdobeAll third-party trademarks, logos, and brand names referenced on this site are the property of their respective owners. Their use does not imply endorsement, sponsorship, or affiliation. Integration availability is subject to change.
Carrier Integrations
Pre-integrated with all major carriers to ensure the best rates and fastest delivery.







/Amazon_(company)-Logo.wine.svg)




All third-party trademarks, logos, and brand names referenced on this site are the property of their respective owners. Their use does not imply endorsement, sponsorship, or affiliation. Integration availability is subject to change.